Emotional Footprint Awards 2024
Analytical Data Store
SoftwareReviews names Google BigQuery, Snowflake, Amazon Redshift, and Oracle Exadata as Analytical Data Store Emotional Footprint Award Winners.
View Category
Analytical Data Store
Emotional Footprint Awards
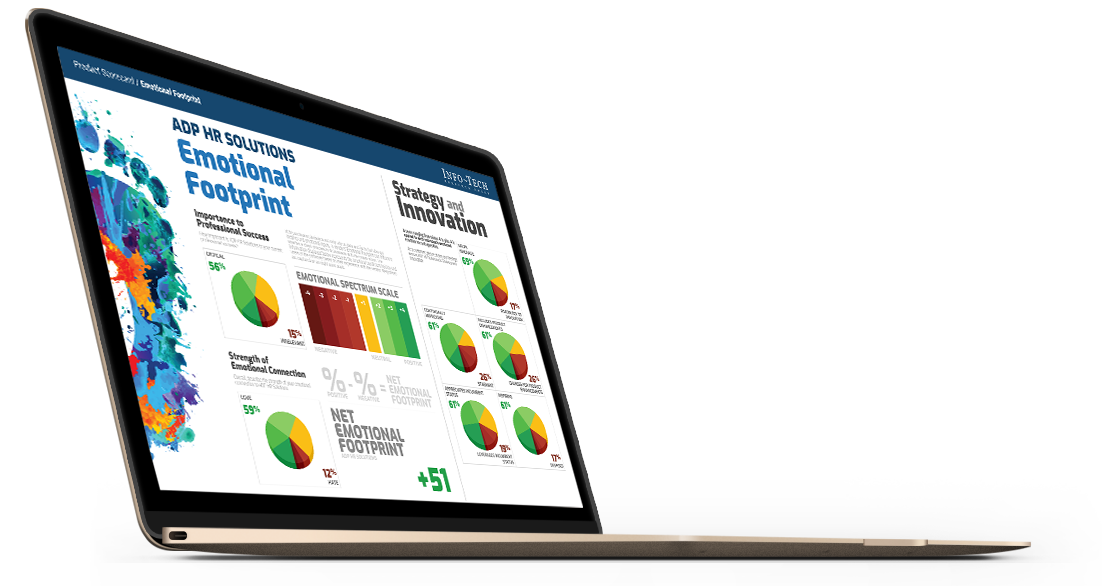
SoftwareReviews Emotional Footprint Awards evaluate and rank products based on emotional response ratings from IT and business professionals. Using our Emotional Footprint methodology, we aggregate emotional footprint scores across 26 dimensions of the vendor-client relationship and product effectiveness, creating a powerful indicator of overall user feeling toward the vendor and product.
Emotional Footprint Awards are proudly founded in 100% user review data and are free of traditional “magical” components such as market presence and analyst opinion, which are opaque in nature and may be influenced by vendor pressure, financial or otherwise.
Read The In-Depth Report
See how each vendor stacks up across each of the 26 dimensions and our thorough evaluation of vendor capabilities, product features, and overall satisfaction.
30+ pages


Measuring Emotional Footprint
Emotional Footprint is scored using our “Net Emotional Footprint” Index. This index tracks responses across 26 dimensions of emotional footprint that span 5 categories: Purchasing, Service Experience, Product Impact, Vendor Strategy, and Conflict Resolution. Then, the following calculation is done across this index:
% of Positive Reviews - % of Negative Reviews
For clarity, the total percentage of positive, neutral, and negative ratings is shown for each vendor as well.
Emotional Footprint Leaders
Google BigQuery
BigQuery is a fully managed, AI-ready data analytics platform that helps you maximize value from your data and is designed to be multi-engine, multi-format, and multi-cloud. Use BigQuery to manage all data types across clouds, structured and unstructured, with fine-grained access controls. BigQuery's serverless architecture lets you use SQL queries to analyze your data. You can store and analyze your data within BigQuery or use BigQuery to assess your data where it lives.
9.1
CX Score
CX
Score
+91
Net Emotional Footprint
Net Emotional
Footprint
90
Value Index
VALUE INDEX

75Reviews
Snowflake
Snowflake
Snowflake’s cloud data platform supports a multi-cloud strategy, including a cross-cloud approach to mix and match clouds as you see fit. Snowflake is available globally on AWS, Azure and Google Cloud Platform. With a common and interchangeable code base, Snowflake delivers advantages such as global data replication, which means you can move your data to any cloud in any region, without having to re-code your applications or learn new skills.
9.1
CX Score
CX
Score
+91
Net Emotional Footprint
Net Emotional
Footprint
87
Value Index
VALUE INDEX

87Reviews
Amazon
Amazon Redshift
Amazon Redshift is used to modernize data analytics workloads and deliver insights into businesses. With a fully managed, AI powered, massively parallel processing (MPP) architecture, Amazon Redshift drives business decision making quickly and cost effectively. Amazon Redshift uses SQL to analyze structured and semi-structured data across data warehouses, operational databases, and data lakes, using AWS-designed hardware and machine learning to deliver optimal performance at any scale.
9.0
CX Score
CX
Score
+92
Net Emotional Footprint
Net Emotional
Footprint
88
Value Index
VALUE INDEX

109Reviews
Oracle
Oracle Exadata
Oracle Exadata is an enterprise database platform that runs Oracle Database workloads of any scale and criticality with high performance, availability, and security. Exadata’s scale-out design employs unique optimizations that let transaction processing, analytics, artificial intelligence, and mixed workloads run faster and more efficiently. Consolidating diverse Oracle Database workloads on Exadata platforms in enterprise data centers, Oracle Cloud Infrastructure (OCI), and multicloud environments helps organizations increase operational efficiency, reduce IT administration, and lower costs.
8.5
CX Score
CX
Score
+96
Net Emotional Footprint
Net Emotional
Footprint
87
Value Index
VALUE INDEX

30Reviews
Other Evaluated Vendors
SAS Institute Inc.
Base SAS
Base SAS Software delivers flexible, extensible 4GL and web-based interface for data access, transformation, and reporting. Based on an open, cross-platform architecture, Base SAS is hardware-agile and integrates into any computing infrastructure, enabling you to unify computing efforts and get a single view of your data. From small data issues to large complex data problems, programmers can read, format, analyze and report on data quickly, regardless of format.
8.2
CX Score
CX
Score
+91
Net Emotional Footprint
Net Emotional
Footprint
85
Value Index
VALUE INDEX
29Reviews
SAP
SAP HANA Cloud
Harness the power of your data and accelerate trusted outcome-driven innovation by developing intelligent and live solutions for real-time decisions and actions on a single data copy. Support next-generation transactional and analytical processing with a broad set of advanced analytics – run securely across hybrid and multicloud environments.
7.9
CX Score
CX
Score
+87
Net Emotional Footprint
Net Emotional
Footprint
86
Value Index
VALUE INDEX
41Reviews
Cloudera
Cloudera Data Platform
Cloudera Data Platform is a hybrid data platform designed for unmatched freedom to choose—any cloud, any analytics, any data. Cloudera delivers fast and easy data management and data analytics for data anywhere, with optimal performance, scalability, and security. Cloudera offers the highest performance and lowest cost platform for using data to drive better business outcomes.
7.9
CX Score
CX
Score
+86
Net Emotional Footprint
Net Emotional
Footprint
86
Value Index
VALUE INDEX
47Reviews
Microsoft Corporation
Microsoft Azure Synapse Analytics
Azure Synapse is a limitless analytics service that brings together enterprise data warehousing and Big Data analytics. It gives you the freedom to query data on your terms, using either serverless or provisioned resources—at scale. Azure Synapse brings these two worlds together with a unified experience to ingest, prepare, manage, and serve data for immediate BI and machine learning needs.
7.8
CX Score
CX
Score
+83
Net Emotional Footprint
Net Emotional
Footprint
79
Value Index
VALUE INDEX
62Reviews
OpenText Corporation
Vertica Analytics Platform
OpenText Vertica Data Platform is an analytical database that can tap into any data, at any scale, anywhere. It allows organizations to modernize their data warehouse, deploy their analytics in a hybrid-cloud environment, and democratize data and analytics. Vertica is designed for scalability and efficiency from the ground up, lowering organizations’ TCO and minimizing server requirements.
7.7
CX Score
CX
Score
+83
Net Emotional Footprint
Net Emotional
Footprint
80
Value Index
VALUE INDEX
27Reviews
Cisco Systems
Splunk Cloud Platform
Splunk Cloud Platform, the Splunk platform capabilities delivered as a service, enables you to make confident decisions and take decisive action on insights from your data without needing to purchase, manage or deploy infrastructure. Splunk Cloud Platform transforms user productivity with streaming, search, analytics, visualization and mobile capabilities, changing the ways users work and interact with data to solve cloudscale problems.
7.6
CX Score
CX
Score
+87
Net Emotional Footprint
Net Emotional
Footprint
77
Value Index
VALUE INDEX
17Reviews
Broadcom
VMWare Tanzu Greenplum
Tanzu Greenplum is a data warehouse, analytics and AI platform that allows you to unify all your data, transforming it into act. VMware Greenplum is a massively parallel processing (MPP) data platform for large-scale analytics and data warehousing, available on-premises and in the cloud.
7.4
CX Score
CX
Score
+83
Net Emotional Footprint
Net Emotional
Footprint
85
Value Index
VALUE INDEX
11Reviews
Teradata
Teradata VantageCloud
Teradata Vantage is the cloud data analytics platform that unifies everything - data lakes, data warehouses, analytics, and new data sources and types. Leading the way with hybrid multi-cloud environments and priced for flexibility, Vantage delivers unlimited intelligence to build the future of your business. Vantage's enterprise-grade, multidimensional scalability lets you scale dimensions simultaneously to handle the massive data workloads of the future, today.
7.1
CX Score
CX
Score
+79
Net Emotional Footprint
Net Emotional
Footprint
79
Value Index
VALUE INDEX
19Reviews
For the full list of vendors in this space, click here.
Download
Get Instant Access<br>to this Report
Get Instant Access
to this Report
Unlock your first report with just a business email. Register to access our entire library.
© 2025 SoftwareReviews.com. All rights reserved.


Contact Us
Welcome to SoftwareReviews!
Before continuing, please take a moment to review and agree to our policies and indicate your email preferences below:
Please sign in via LinkedIn to access your free .
Signing in also unlocks access to the dynamic version of the Data Quadrant, which plots vendors based on verified user reviews! Customize the Data Quadrant according to the features and sentiments that matter most to you.
Please note: the dynamic version of the Data Quadrant continues to collect data after report publication, and may show new data that will appear in next year's report.
This offer is available until May 31, 2020. These reports are intended for internal strategic use only and are not authorized for redistribution. For permission to reuse content, please contact vendors@softwarereviews.com.


.png?1727865023)

