Info-Tech Research Group
SoftwareReviews
Search tips
Search for products, categories, or vendors.
Try keywords like 'management', 'Microsoft', or 'CRM'
Search for "" by hitting enter, or see suggested results.
  • Write a Review
  • Categories
  • Compare
  • About Us
  • For Vendors
    • Browse Reports
    • Awards
    • Research
    • What We Do
Log in Log in
Write a Review

Home > Awards > A/B Testing

Emotional Footprint Awards 2024

A/B Testing


SoftwareReviews names as A/B Testing Emotional Footprint Award Winners.


View Category

A/B Testing

Emotional Footprint Awards

SoftwareReviews Emotional Footprint Awards evaluate and rank products based on emotional response ratings from IT and business professionals. Using our Emotional Footprint methodology, we aggregate emotional footprint scores across 26 dimensions of the vendor-client relationship and product effectiveness, creating a powerful indicator of overall user feeling toward the vendor and product.

Emotional Footprint Awards are proudly founded in 100% user review data and are free of traditional “magical” components such as market presence and analyst opinion, which are opaque in nature and may be influenced by vendor pressure, financial or otherwise.

Read The In-Depth Report

See how each vendor stacks up across each of the 26 dimensions and our thorough evaluation of vendor capabilities, product features, and overall satisfaction.

Download Now

30+ pages

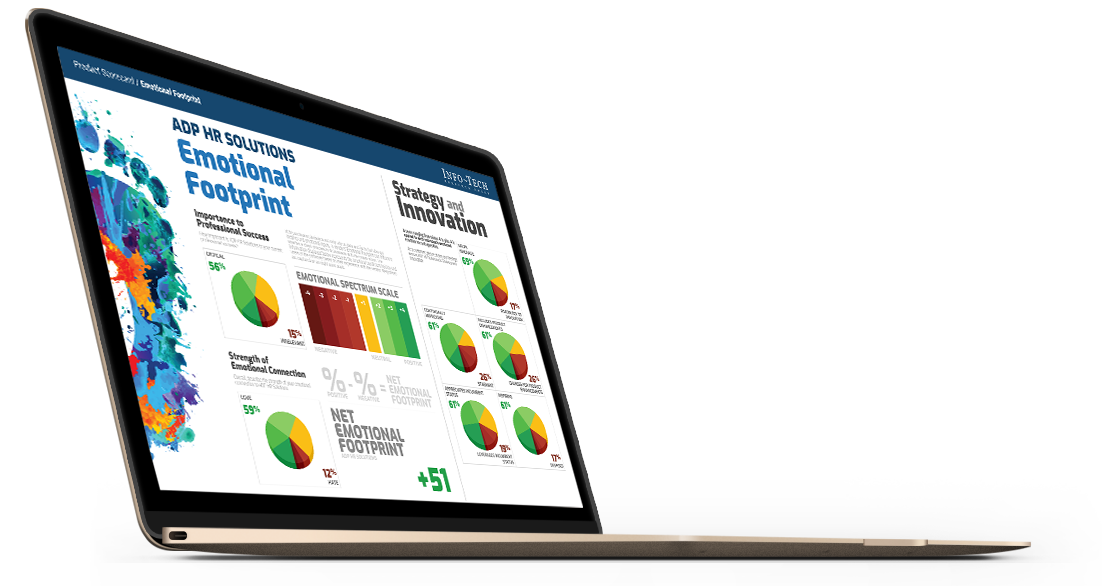
Measuring Emotional Footprint

Emotional Footprint is scored using our “Net Emotional Footprint” Index. This index tracks responses across 26 dimensions of emotional footprint that span 5 categories: Purchasing, Service Experience, Product Impact, Vendor Strategy, and Conflict Resolution. Then, the following calculation is done across this index:

% of Positive Reviews - % of Negative Reviews

For clarity, the total percentage of positive, neutral, and negative ratings is shown for each vendor as well.

Other Evaluated Vendors


Google Analytics logo
  • X/Twitter
  • LinkedIn
  • Website
31Reviews
Google Analytics logo
  • X/Twitter
  • LinkedIn
  • Website

Google

Google Analytics

Get a complete understanding of your customers across devices and platforms. Google Analytics gives you the tools, free of charge, to understand the customer journey and improve marketing ROI.

8.7

CX Score

CX
Score

+82

Net Emotional Footprint

Net Emotional
Footprint

91

Value Index

VALUE INDEX

Use regions/landmarks to skip ahead to chart and navigate between data series.

Summary.

Chart

Long description.

No description available.

Structure.

Chart type: bar chart.
The chart has 1 X axis displaying categories.
The chart has 1 Y axis displaying values.

Chart graphic.

ChartCreated with Highcharts 5.0.2
6% Negative 88% Positive
31Reviews
Write a Review
Product Report

15+
pages

HubSpot Marketing Hub logo
  • X/Twitter
  • LinkedIn
  • Website
13Reviews
HubSpot Marketing Hub logo
  • X/Twitter
  • LinkedIn
  • Website

HubSpot

HubSpot Marketing Hub

From attracting visitors to closing customers, HubSpot brings your entire marketing funnel together for less hassle, more control, and an inbound marketing strategy that actually works.

7.9

CX Score

CX
Score

+84

Net Emotional Footprint

Net Emotional
Footprint

87

Value Index

VALUE INDEX

Use regions/landmarks to skip ahead to chart and navigate between data series.

Summary.

Chart

Long description.

No description available.

Structure.

Chart type: bar chart.
The chart has 1 X axis displaying categories.
The chart has 1 Y axis displaying values.

Chart graphic.

ChartCreated with Highcharts 5.0.2
3% Negative 87% Positive
13Reviews
Write a Review
Product Report

15+
pages

Optimizely Web Experimentation logo
  • X/Twitter
  • LinkedIn
  • Website
12Reviews
Optimizely Web Experimentation logo
  • X/Twitter
  • LinkedIn
  • Website

Optimizely, Inc.

Optimizely Web Experimentation

Optimizely Web Experimentation is a platform that allows you to experiment via A/B or multi-variant testing on any channel or device with an internet connection. Built for the enterprise, the platform is a front-end A/B and multi-page experimentation product that uses features like exclusion groups that let you safely run multiple experiments on the same page.

7.2

CX Score

CX
Score

+73

Net Emotional Footprint

Net Emotional
Footprint

82

Value Index

VALUE INDEX

Use regions/landmarks to skip ahead to chart and navigate between data series.

Summary.

Chart

Long description.

No description available.

Structure.

Chart type: bar chart.
The chart has 1 X axis displaying categories.
The chart has 1 Y axis displaying values.

Chart graphic.

ChartCreated with Highcharts 5.0.2
3% Negative 76% Positive
12Reviews
Write a Review
Product Report

15+
pages

AB Tasty logo
  • LinkedIn
  • Website
13Reviews
AB Tasty logo
  • LinkedIn
  • Website

AB Tasty

AB Tasty

AB Tasty is the platform for customer experience optimization, with features like experimentation, personalization, and product optimization to streamline your users along the buyer journey. Whether your KPI is a fast conversion, a subscription, or frequency of use, the platform is built to optimize every digital touchpoint from paid landing page to mobile checkout.

6.8

CX Score

CX
Score

+72

Net Emotional Footprint

Net Emotional
Footprint

75

Value Index

VALUE INDEX

Use regions/landmarks to skip ahead to chart and navigate between data series.

Summary.

Chart

Long description.

No description available.

Structure.

Chart type: bar chart.
The chart has 1 X axis displaying categories.
The chart has 1 Y axis displaying values.

Chart graphic.

ChartCreated with Highcharts 5.0.2
6% Negative 78% Positive
13Reviews
Write a Review
Product Report

15+
pages

VWO Testing logo
  • LinkedIn
  • Website
10Reviews
VWO Testing logo
  • LinkedIn
  • Website

Wingify

VWO Testing

VWO Testing helps you run powerful A/B, multi-variate, split, multi-device, and multi-page tests on your website to turn your visitors into paying customers. The VWO Platform takes you one step ahead of the conventional experimentation tools by helping you weave a complete picture of your user and create personalized digital experiences which maximize conversions.

6.7

CX Score

CX
Score

+65

Net Emotional Footprint

Net Emotional
Footprint

79

Value Index

VALUE INDEX

Use regions/landmarks to skip ahead to chart and navigate between data series.

Summary.

Chart

Long description.

No description available.

Structure.

Chart type: bar chart.
The chart has 1 X axis displaying categories.
The chart has 1 Y axis displaying values.

Chart graphic.

ChartCreated with Highcharts 5.0.2
11% Negative 76% Positive
10Reviews
Write a Review
Product Report

15+
pages

Adobe Target logo
  • X/Twitter
  • LinkedIn
  • Website
12Reviews
Adobe Target logo
  • X/Twitter
  • LinkedIn
  • Website

Adobe Systems

Adobe Target

Adobe Target is the Adobe Experience Cloud solution that provides everything you need to tailor and personalize your customers’ experiences. Target helps you maximize revenue on your web and mobile sites, apps, social media, and other digital channels. With Adobe Target, you get AI-powered testing, personalization and automation at scale, so you can find that one customer out of a million, and give them what they want.

6.1

CX Score

CX
Score

+46

Net Emotional Footprint

Net Emotional
Footprint

79

Value Index

VALUE INDEX

Use regions/landmarks to skip ahead to chart and navigate between data series.

Summary.

Chart

Long description.

No description available.

Structure.

Chart type: bar chart.
The chart has 1 X axis displaying categories.
The chart has 1 Y axis displaying values.

Chart graphic.

ChartCreated with Highcharts 5.0.2
19% Negative 65% Positive
12Reviews
Write a Review
Product Report

15+
pages

For the full list of vendors in this space, click here.

Download

Get Instant Access<br>to this Report

Get Instant Access
to this Report

Unlock your first report with just a business email. Register to access our entire library.

© 2025 SoftwareReviews.com. All rights reserved.

Contact Us

* Starred fields are required

Terms of Use and Privacy Policy and agree that SoftwareReviews and relevant software vendors may contact me regarding my request." autocomplete="off" />

Or, email us at hello@softwarereviews.com

Welcome to SoftwareReviews!

Before continuing, please take a moment to review and agree to our policies and indicate your email preferences below:

Terms of Use and Privacy Policy and agree that SoftwareReviews and relevant software vendors may contact me regarding my request." autocomplete="off" />

Please sign in via LinkedIn to access your free .

Signing in also unlocks access to the dynamic version of the Data Quadrant, which plots vendors based on verified user reviews! Customize the Data Quadrant according to the features and sentiments that matter most to you.

Please note: the dynamic version of the Data Quadrant continues to collect data after report publication, and may show new data that will appear in next year's report.

This offer is available until May 31, 2020. These reports are intended for internal strategic use only and are not authorized for redistribution. For permission to reuse content, please contact vendors@softwarereviews.com.

Info-Tech Research Group
SoftwareReviews

SoftwareReviews empowers organizations with the best data, insights, and advice to improve the software buying and selling experience.

Follow

  • LinkedIn
  • X/Twitter
  • Facebook

Certifications

AICPA SOC Certification Cyber Essentials Certification PwC ISO 27001 Information Security Certification

This site is protected by reCAPTCHA and the Google Privacy Policy and Terms of Service apply.

© 2025 SoftwareReviews.com. All rights reserved.

Menu

  • Log in
  • Categories
  • Reports
  • For Vendors

Site Map

  • About Us
  • Careers
  • Press Releases
  • Terms & Conditions
  • Privacy Policy
  • Opt Out: Selling Personal Data