Emotional Footprint Awards 2023
Environmental, Social and Governance Reporting
SoftwareReviews names FigBytes, Emitwise, EHS Insight, EnergyCAP, ServiceNow ESG Management, and Diligent Sustainability Reporting Software as Environmental, Social and Governance Reporting Emotional Footprint Award Winners.
View Category
Environmental, Social and Governance Reporting
Emotional Footprint Awards
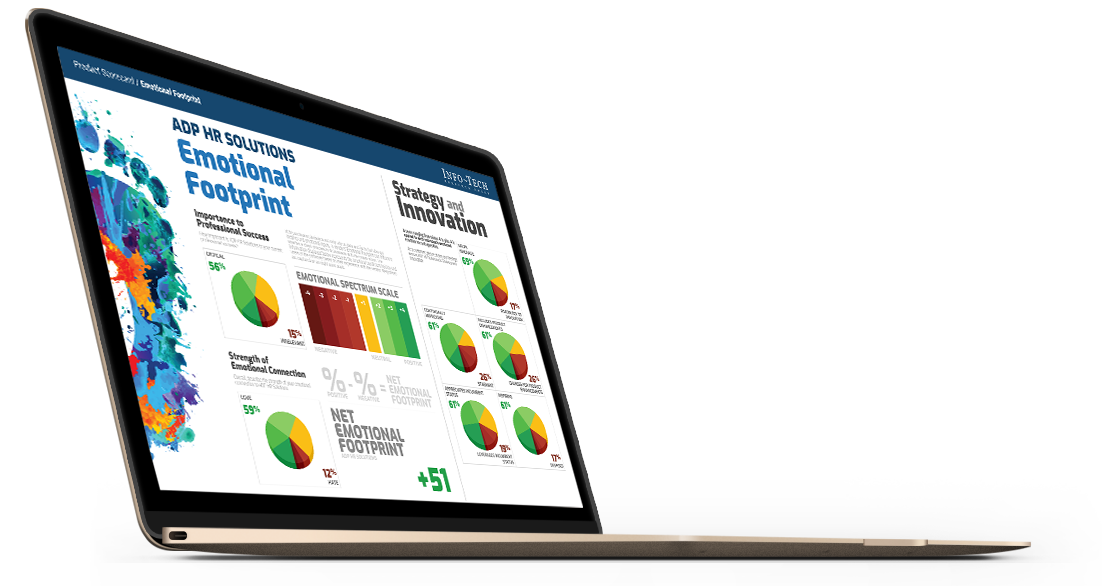
SoftwareReviews Emotional Footprint Awards evaluate and rank products based on emotional response ratings from IT and business professionals. Using our Emotional Footprint methodology, we aggregate emotional footprint scores across 26 dimensions of the vendor-client relationship and product effectiveness, creating a powerful indicator of overall user feeling toward the vendor and product.
Emotional Footprint Awards are proudly founded in 100% user review data and are free of traditional “magical” components such as market presence and analyst opinion, which are opaque in nature and may be influenced by vendor pressure, financial or otherwise.
Read The In-Depth Report
See how each vendor stacks up across each of the 26 dimensions and our thorough evaluation of vendor capabilities, product features, and overall satisfaction.
30+ pages


Measuring Emotional Footprint
Emotional Footprint is scored using our “Net Emotional Footprint” Index. This index tracks responses across 26 dimensions of emotional footprint that span 5 categories: Purchasing, Service Experience, Product Impact, Vendor Strategy, and Conflict Resolution. Then, the following calculation is done across this index:
% of Positive Reviews - % of Negative Reviews
For clarity, the total percentage of positive, neutral, and negative ratings is shown for each vendor as well.
Emotional Footprint Leaders
AMCS group
FigBytes
The FigBytes Sustainability Platform empowers impact-focused organizations to make positive change for people and the planet. Our software transforms complex Environmental, Social, and Governance information into simple reporting and actionable insights by capturing operational and supplier data in a central, secure, cloud-based platform that manages strategy, automates framework reporting, and simplifies stakeholder engagement. The FigBytes platform is purpose-built and supported by our team of advisors and technology experts to address the unique needs of sustainability leaders today and scalable to meet the evolving issues and regulations of tomorrow.
9.3
CX Score
CX
Score
+99
Net Emotional Footprint
Net Emotional
Footprint
93
Value Index
VALUE INDEX

28Reviews
Emitwise
Emitwise
Emitwise is the carbon management platform for companies with complex manufacturing supply chains to confidently understand, track and reduce their complete carbon footprint. Combining 100 years of carbon accounting experience and machine learning technology, we accelerate climate action by increasing the accuracy of scope 3 emissions. The platform empowers manufacturers and their supply chains to make carbon-led business decisions that lower risk, increase profitability and deliver ambitious climate action.
8.5
CX Score
CX
Score
+99
Net Emotional Footprint
Net Emotional
Footprint
87
Value Index
VALUE INDEX

12Reviews
StarTex Software
EHS Insight
EHS Insight is an all-in-one Environmental, Health and Safety software platform. Establish a safe and efficient work environment, minimize risk, and meet compliance standards.
8.5
CX Score
CX
Score
+95
Net Emotional Footprint
Net Emotional
Footprint
91
Value Index
VALUE INDEX

10Reviews
EnergyCAP
EnergyCAP
EnergyCAP is a powerful energy management software application for managing utility bill data. EnergyCAP is a single source of truth for energy and sustainability teams, This energy and sustainability software gives you instant access to actionable data you can trust to better manage resource consumption, reduce your carbon footprint, and drive massive savings.
8.3
CX Score
CX
Score
+91
Net Emotional Footprint
Net Emotional
Footprint
90
Value Index
VALUE INDEX

14Reviews
ServiceNow
ServiceNow ESG Management
Elevate your environmental, social, and governance (ESG) program with simple data collection, on-demand progress monitoring, and automated reporting.
8.2
CX Score
CX
Score
+91
Net Emotional Footprint
Net Emotional
Footprint
86
Value Index
VALUE INDEX

14Reviews
Diligent
Diligent Sustainability Reporting Software
No matter where you are on your ESG journey, simplify data collection, benchmarking and reporting. Map your ESG data against a variety of standards including SASB, GRI, TCFD, CDP and WEF, easily pull ESG data from surveys and spreadsheets across your organization using workflows, reminders and robotic automation.
8.1
CX Score
CX
Score
+89
Net Emotional Footprint
Net Emotional
Footprint
89
Value Index
VALUE INDEX

11Reviews
Other Evaluated Vendors
Workiva Inc
Workiva ESG
Workiva is a cloud native platform that simplifies the complexities of reporting and compliance. Workiva ESG is the end-to-end platform that allows you to integrate financial data, nonfinancial data, and XBRL. Workiva, the platform that streamlines your entire ESG process. Automate data collection, utilize frameworks, and directly connect to all your ESG reports. in meaningful glossy reports, accurate survey responses, and regulatory filings with integrated XBRL tagging.
8.0
CX Score
CX
Score
+92
Net Emotional Footprint
Net Emotional
Footprint
82
Value Index
VALUE INDEX
14Reviews
Benchmark Gensuite
Benchmark ESG Reporting
Benchmark's digital sustainability and ESG reporting solutions offer the efficiency, reliability, and visibility you need to meet stringent and time-sensitive demands and uncover opportunities to improve performance. With Benchmark sustainability and ESG Reporting capabilities, you can connect systems and teams across the enterprise, automate and streamline workflows, standardize processes and data, access common and customizable ESG KPIs, align with standard reporting frameworks, easily respond to ad hoc requests and use built-in analytics to uncover business risk and opportunities.
7.9
CX Score
CX
Score
+91
Net Emotional Footprint
Net Emotional
Footprint
81
Value Index
VALUE INDEX
10Reviews
ESP
ESP CSR
ESP is on a mission to make a positive impact for the planet by supporting organisations to embed sustainability into their performance. We help our customers to measure, monitor, report and reduce carbon emissions and utility expenditure with AI-powered, audit-ready carbon accounting and utility management software & services. CSR is our corporate carbon management solution, combining cutting-edge software supported by a world-class team of sustainability experts. Accurate, flexible, and auditable - CSR addresses the sustainability data needs of teams managing facilities with complex operational emission profiles and exacting reporting expectations.
7.7
CX Score
CX
Score
+78
Net Emotional Footprint
Net Emotional
Footprint
78
Value Index
VALUE INDEX
28Reviews
Intelex Technologies Inc.
Intelex ESG Management
Intelex ESG Management is Environmental, Social, and Governance (ESG) Software. Intelex ESG Management provides the transparency and cross organizational visibility needed to truly gain insightful ESG intelligence, provide timely stakeholder communications and disclosure reporting, and focus on key ESG and sustainability performance improvement areas.
7.6
CX Score
CX
Score
+83
Net Emotional Footprint
Net Emotional
Footprint
81
Value Index
VALUE INDEX
11Reviews
IBM
Envizi
IBM Envizi ESG Suite is SaaS that consolidates enterprise ESG data for analysis and reporting. We remove the challenges and complexity of ESG data collection, analysis and reporting so you can harness the power of data to fast-track your success. Simplify the capture, consolidation, management, analysis and reporting of your environmental, social and governance (ESG) data
7.1
CX Score
CX
Score
+71
Net Emotional Footprint
Net Emotional
Footprint
82
Value Index
VALUE INDEX
11Reviews
Ecometrica
Ecometrica Sustainability Reporting
Ecometrica’s Sustainability Reporting software is an end-to-end environmental accounting and sustainability management solution. It is used by companies to collect a diverse, georeferenced data set, going beyond traditional sustainability reporting. Ecometrica is an end-to-end environmental software-as-a-service (SaaS) provider experience in helping businesses and governments identify risks and opportunities by combining satellite earth observation data with local information and business intelligence on the Ecometrica Platform.
6.5
CX Score
CX
Score
+63
Net Emotional Footprint
Net Emotional
Footprint
75
Value Index
VALUE INDEX
10Reviews
For the full list of vendors in this space, click here.
Download
Get Instant Access<br>to this Report
Get Instant Access
to this Report
Unlock your first report with just a business email. Register to access our entire library.
© 2025 SoftwareReviews.com. All rights reserved.


Contact Us
Welcome to SoftwareReviews!
Before continuing, please take a moment to review and agree to our policies and indicate your email preferences below:
Please sign in via LinkedIn to access your free .
Signing in also unlocks access to the dynamic version of the Data Quadrant, which plots vendors based on verified user reviews! Customize the Data Quadrant according to the features and sentiments that matter most to you.
Please note: the dynamic version of the Data Quadrant continues to collect data after report publication, and may show new data that will appear in next year's report.
This offer is available until May 31, 2020. These reports are intended for internal strategic use only and are not authorized for redistribution. For permission to reuse content, please contact vendors@softwarereviews.com.

.png?1700307017)


